Letter to the Editor: “Comparison of diagnostic performance of the ACR and Kwak TIRADS applying the ACR TIRADS’ size thresholds for FNA”
by Chao Fu, Yiyang Cui, Jing Li, Kefei Cui (cuikefei2010@126.com)
Comparison of diagnostic performance of the ACR and Kwak TIRADS applying the ACR TIRADS’ size thresholds for FNADear Editor,
We read with interest the article by Sun Huh et al [1] in the Jul 2021 issue of European Radiology. In this article, the authors showed the modified Kwak-TIRADS incorporating the size thresholds of the ACR-TIRADS seen higher diagnostic performance and a lower unnecessary FNA rate than the original Kwak-TIRADS, which they believed was caused by the ACR-TIRADS’s higher threshold for FNA. Unfortunately, this result may be influenced by the proportion of nodule numbers and the size distribution of nodules in Kwak-TIRADS 4a and 4b categories in the enrolled sample.
The frequency of events (i.e. disease) in the enrolled sample is known to influence diagnostic tests [2]. In detail, the malignancy rate, the proportion of nodule numbers and the size distribution of nodules in each category may have influenced this result. Since hospital admission criteria and study eligibility criteria were different, the enrolled sample differed accordingly. In this study, the proportion of nodule numbers and the size distribution of nodules in Kwak-TIRADS 4a and 4b categories were the main factors. Moreover, the threshold has been used to overcome the overdiagnosis of thyroid cancer, rather than enhance the diagnostic performance of RSS. In this sense, those results should be dealt with caution.
The research was repeated in our dataset. The results of Sun Huh et al differ from those of our study showing higher specificity, accuracy, AUC, and lower unnecessary FNA rate associated with the original Kwak-TIRADS, compared with the Kwak-TIRADS which incorporated the ACR-TIRADS’ size thresholds (81.4% vs 73.6%, 64.1% vs 59.7%, 0.623 vs 0.582, 34.4% vs 42.9%, p < 0.05 for all). To interpret the discordance, only the malignancy rate, the proportion of nodule numbers and the size distribution of nodules in Kwak-TIRADS 4a and 4b categories can be used. Figure 1 shows the malignancy rate, the size distribution of nodule numbers, and the proportion of each category with Kwak-TIRADS in our dataset.
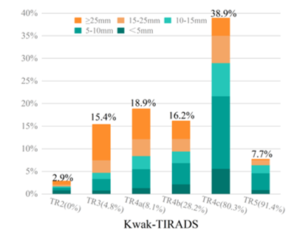
Fig.1 The calculated malignancy rates, proportion of nodule numbers and the size distribution of nodules at each category in the Kwak-TIRADS were plotted on the bar graph with the abscissa as categories and the ordinate as proportion of number. Numbers in brackets depict the calculated malignancy rates in each category.